


Why Most Teams Collect Too Much, Understand Too Little, and Optimize the Wrong Things
The Core Problem: You Don’t Lack Data — You Lack Interpretation
Most companies today are not data-poor.
They are insight-poor.
Dashboards are full. Metrics are tracked. Reports are generated weekly, sometimes daily. Yet when it comes to decision-making, teams still rely on intuition, fragmented signals, or whatever metric looks most convincing at the moment.
This isn’t a tooling issue. It’s a structural one.
Because data, on its own, does not create clarity.
It creates noise — unless you know how to read it.
And the uncomfortable truth is this:
Most teams are not misled by missing data.
They are misled by misinterpreted data.
The First Mistake: Treating Metrics as Truth Instead of Signals
Metrics feel objective. Numbers look precise. But in reality, most marketing data is directional, not absolute.
Platforms like Google openly acknowledge that attribution models are probabilistic, not exact:
- Google Ads attribution overview: https://support.google.com/google-ads/answer/6259715
This means:
- your reported conversions are modeled estimates
- your ROAS is context-dependent
- your channel performance is partially inferred
And yet, teams often treat these numbers as hard truth.
| What Teams Think Data Is | What Data Actually Is |
|---|---|
| Objective truth | Approximation |
| Complete picture | Partial visibility |
| Direct answer | Signal requiring context |
Data doesn’t tell you what to do. It tells you where to look deeper.
The Second Mistake: Tracking Too Much, Too Early
When companies become “data-driven,” they often try to track everything:
- every click
- every scroll
- every micro-interaction
The result is not clarity — it’s overload.
Instead of understanding what drives outcomes, teams drown in low-impact metrics that feel important but don’t influence decisions.
The Illusion of Measurement
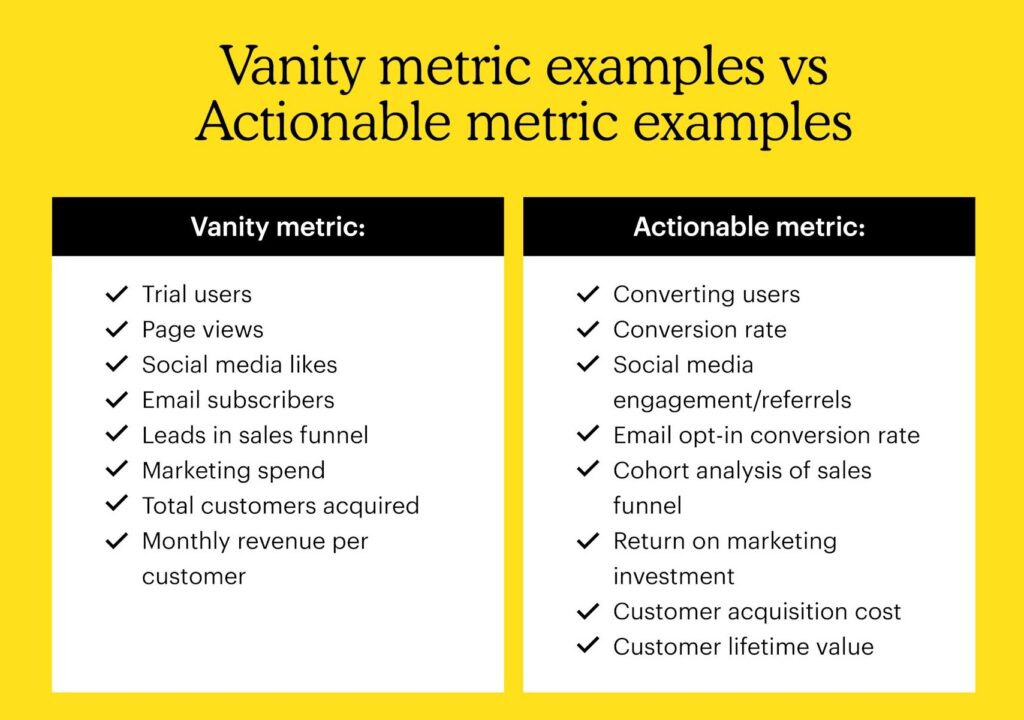
| Metric Type | Example | Real Value |
|---|---|---|
| Vanity metrics | Impressions | Low |
| Engagement metrics | CTR, time on page | Medium |
| Outcome metrics | Conversions, revenue | High |
Most teams invert this hierarchy.
They optimize what’s easiest to measure — not what matters most.
What Data You Should Actually Collect First
Before building complex dashboards, you need a minimal, high-signal data foundation.
Not everything. Just what drives decisions.
1. Conversion Data (Your Ground Truth)
If you don’t measure outcomes correctly, nothing else matters.
At minimum, you need:
- purchases / leads
- revenue per conversion
- conversion timestamp
- source (even if imperfect)
Without this, optimization becomes guesswork.
2. Cost Data (Your Efficiency Layer)
Understanding performance without cost is meaningless.
You need:
- cost per channel
- cost per campaign
- cost per acquisition (CPA)
Only by combining cost + conversion can you evaluate efficiency.
3. User Journey Signals (Your Context Layer)
Conversions don’t happen in isolation.
You need to understand:
- how users arrive
- how many touchpoints they need
- where they drop off
Even basic funnel visibility dramatically improves interpretation.
Minimal Data Stack
| Layer | Purpose |
|---|---|
| Conversion data | Measure outcomes |
| Cost data | Measure efficiency |
| Journey data | Understand behavior |
Everything else is secondary.
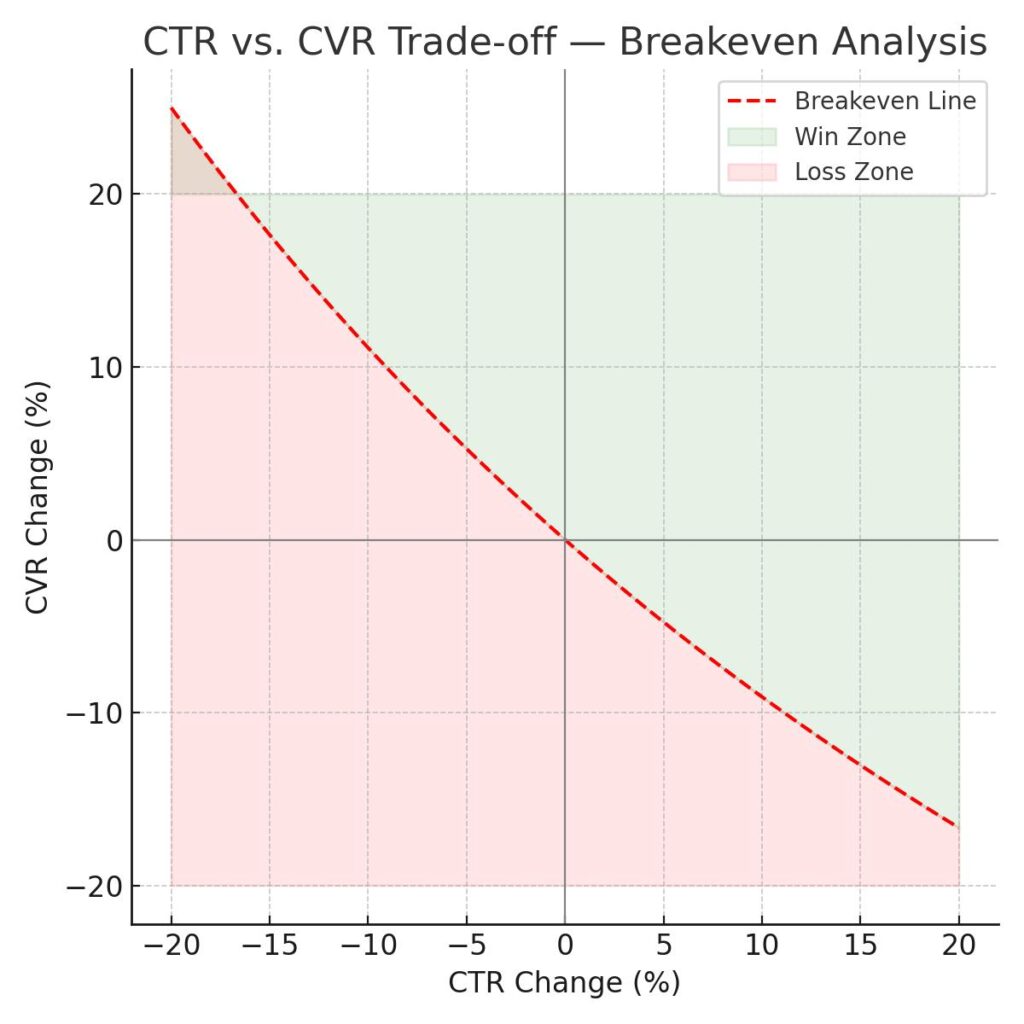
The Third Mistake: Ignoring Data Relationships
Looking at metrics in isolation is one of the fastest ways to misinterpret reality.
For example:
- CTR goes up → seems positive
- Conversion rate goes down → seems negative
What does it mean?
It depends on how they interact.
Data Without Context Misleads
| Metric Change | Possible Interpretation |
|---|---|
| CTR ↑, CVR ↓ | Broader audience, lower intent |
| CTR ↓, CVR ↑ | Narrow targeting, higher quality |
| Traffic ↑ | Could be low-quality expansion |
👉 No metric has meaning alone.
👉 Only relationships create insight.
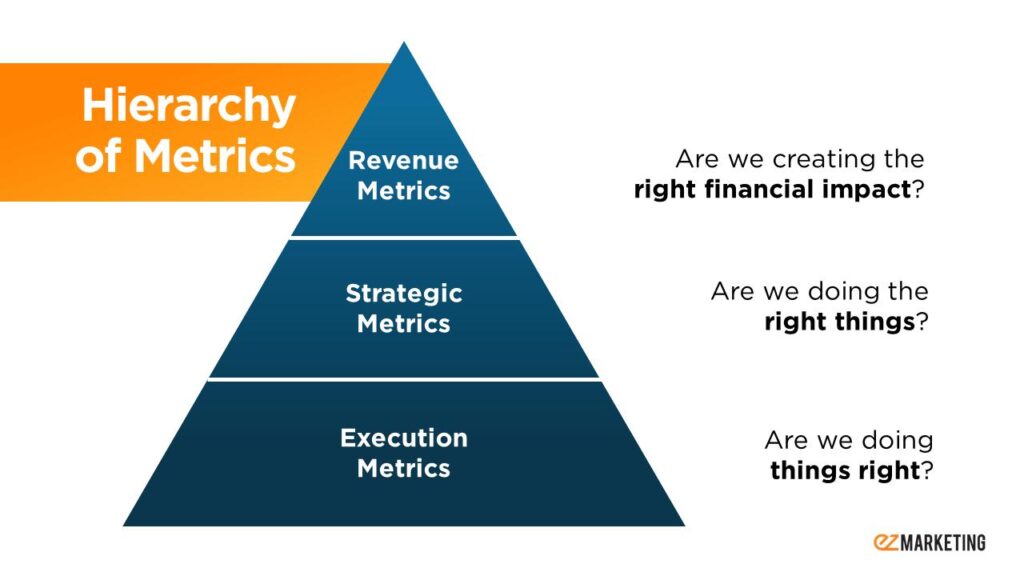
The Fourth Mistake: Optimizing Lagging Metrics
Most teams optimize for what is easiest to see:
- ROAS
- CPA
- revenue
But these are lagging indicators. They tell you what already happened.
By the time they change, the problem already exists.
What High-Performance Teams Track Instead
They focus on leading indicators:
- CTR decay
- frequency growth
- CPM shifts
- conversion rate changes by segment
These signals show problems before revenue drops.
Leading vs Lagging Metrics
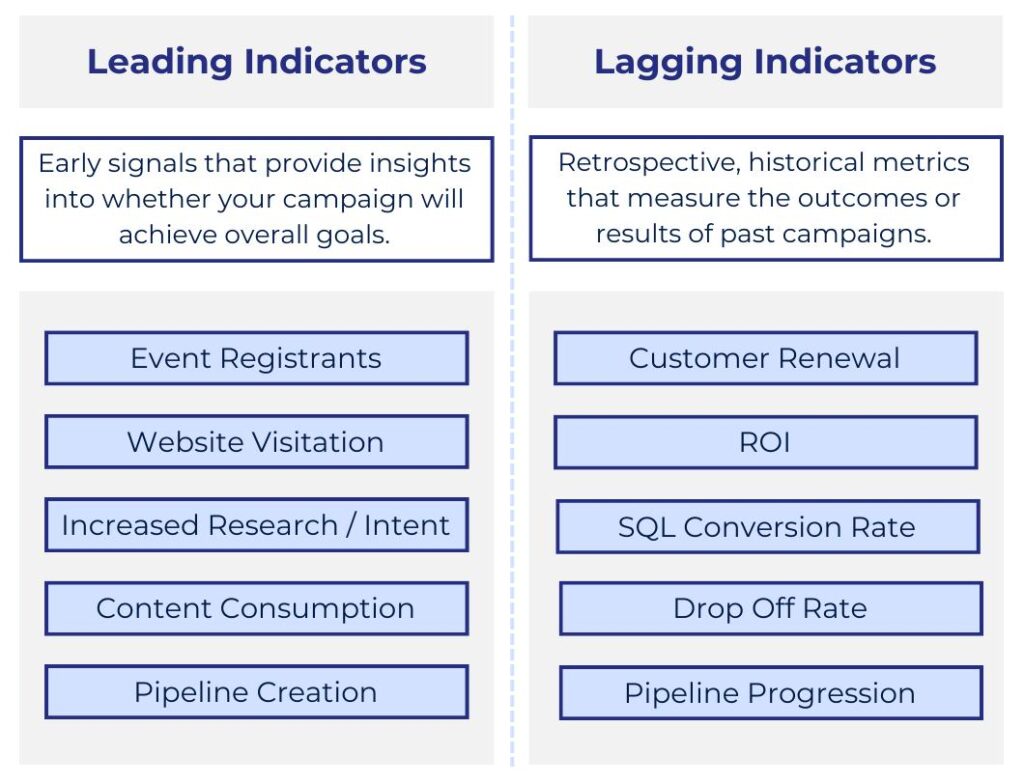
| Type | Example | Role |
|---|---|---|
| Leading | CTR, frequency | Early warning signals |
| Lagging | ROAS, revenue | Outcome confirmation |
How to Actually Interpret Data (The Practical Framework)
Instead of asking:
👉 “What do the numbers say?”
Ask:
- What changed?
- Where did it change? (segment, channel, audience)
- What else changed at the same time?
- Is this signal or noise?
- What decision does this enable?
If data doesn’t lead to a decision, it’s not useful.
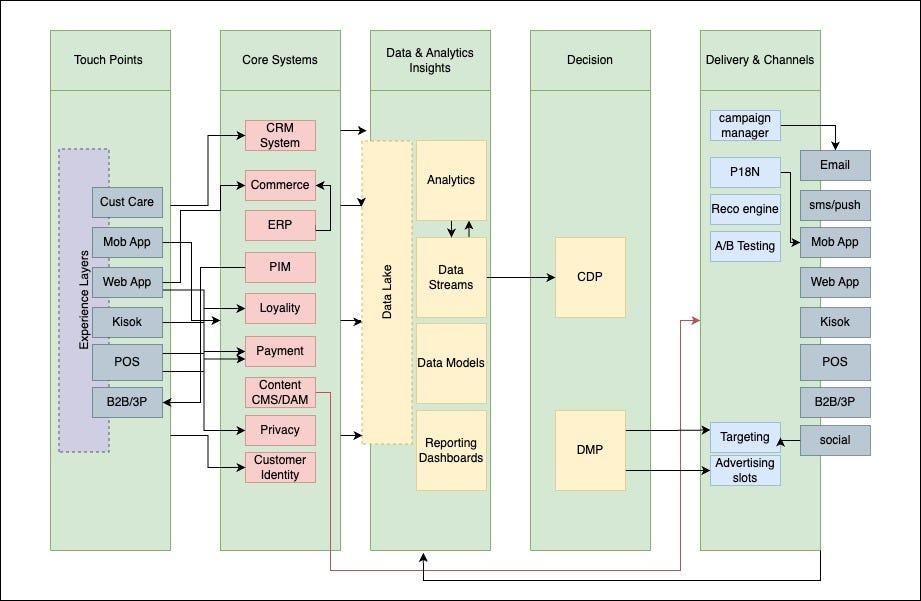
The Real Shift: From Data Collection to Decision Systems
The goal is not to collect more data.
It is to build a system where:
- signals are clear
- relationships are visible
- decisions are faster
Because the real competitive advantage is not data.
It’s how quickly and accurately you act on it.
Conclusion: Data Doesn’t Give Answers — It Reduces Uncertainty
Data will never give you perfect clarity.
At best, it reduces uncertainty enough for you to act with confidence.
The mistake most teams make is waiting for certainty.
High-performing teams operate with incomplete but correctly interpreted information.
Why This Matters — And Where We Come In
At ScaleTogether, we don’t just build dashboards.
We design decision systems:
- what to track
- what to ignore
- how to interpret signals
- and how to act before performance drops
Because having data is easy.
Understanding it — and using it correctly under pressure — is what actually drives growth.
👉 If your team is collecting more and more data but still struggling to make confident decisions, the problem isn’t tools.
It’s interpretation.
And that’s exactly what we fix.